High person confused by overspecific 3D animal classification chart
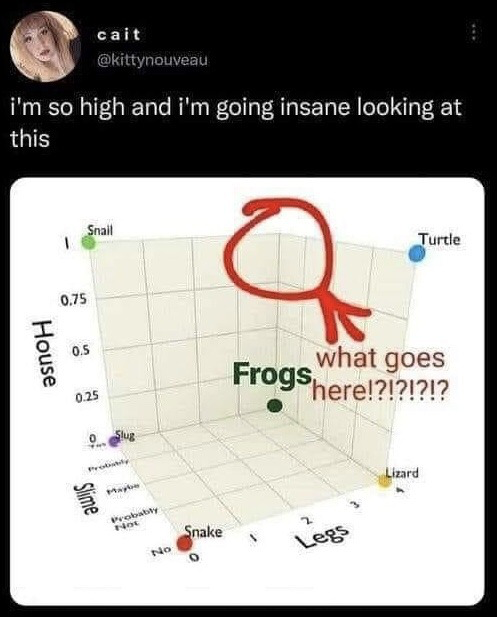
i'm so high and i'm going insane looking at this
Text content
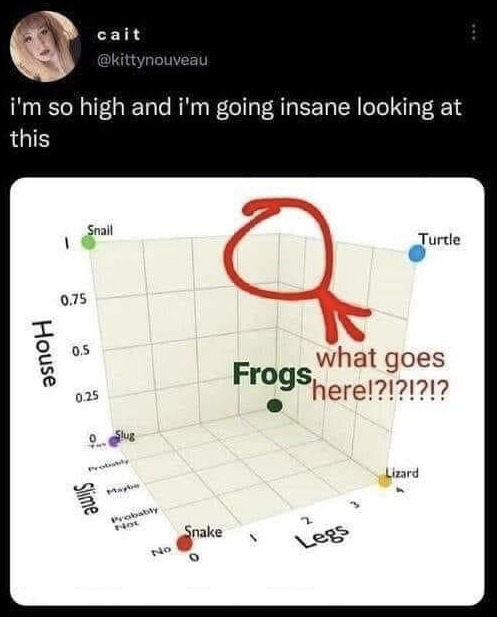
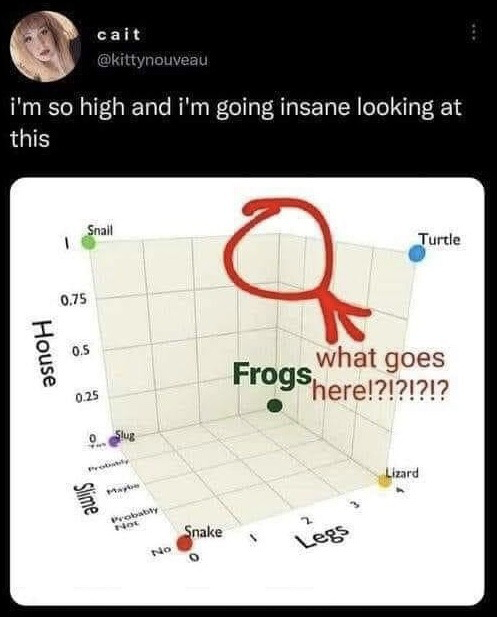
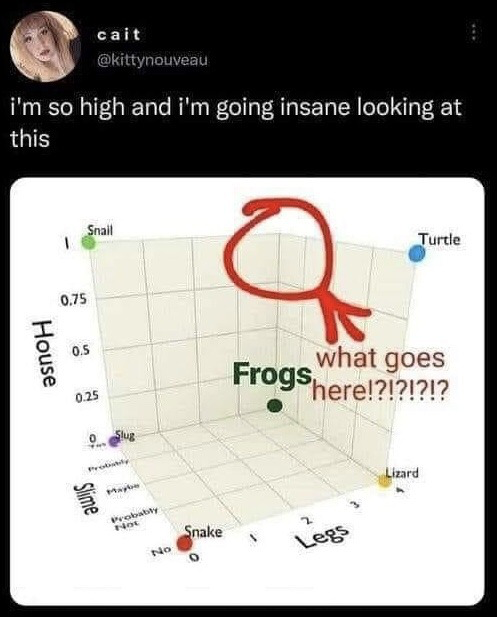
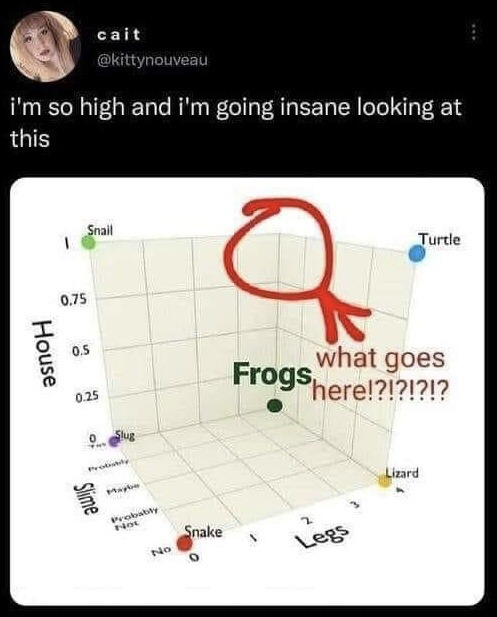
3D scatter plot axes: House, Slime, Legs; plotted animal labels: Snail, Slug, Snake, Lizard, Frogs, Turtle; handwritten annotation: what goes here!?!?!?!?!
Overview
This is a screenshot of a public X (formerly Twitter) post. The post author's profile picture is a headshot of a blonde woman, with the display name 'cait' and username @kittynouveau. The post body text reads: 'i'm so high and i'm going insane looking at this'. Attached to the post is a 3D scatter plot with three axes: the vertical Y axis labeled 'House' (ranging from 0 to 1, measuring how much an animal is a suitable house pet), the bottom left X axis labeled 'Slime' (ranging from 'No' to 'Yes', measuring how slimy the animal is), and the bottom right Z axis labeled 'Legs' (ranging from 0 to 4, measuring the number of legs the animal has). Plotted animals on the chart include Snail, Slug, Snake, Lizard, Frog, and Turtle. A hand-drawn red circle points to an empty spot on the upper end of the axes, with accompanying text asking 'what goes here!?!?!?!?!', highlighting how difficult this over-specific 3D chart is to parse when the viewer is intoxicated.
Origin notes
This meme originates as a post shared by X (Twitter) user @kittynouveau. It was later reposted to the X meme account 'meme.jpg' and distributed via its RSS feed. The meme gained popularity for its relatable comedic premise of being disoriented by overly complicated, niche data visualizations while under the influence of intoxicants.